Introduction
Securing the Buy Box is often seen as the ultimate goal for sellers. But while the Buy Box captures pricing, shipping speed, and ratings, it can't tell you why a product is selling. Returns data can—and in Q4, why matters more than how many.
Returns are an early-warning system disguised as a cost line. When a product sells fast and comes back fast, that's not success—it's a signal. This article shows how to read that signal, spot which Q4 "winners" are inflated by gifts, panic buying, and discount traffic, and act before they stall in March.
The Hidden Insights in Returns Data
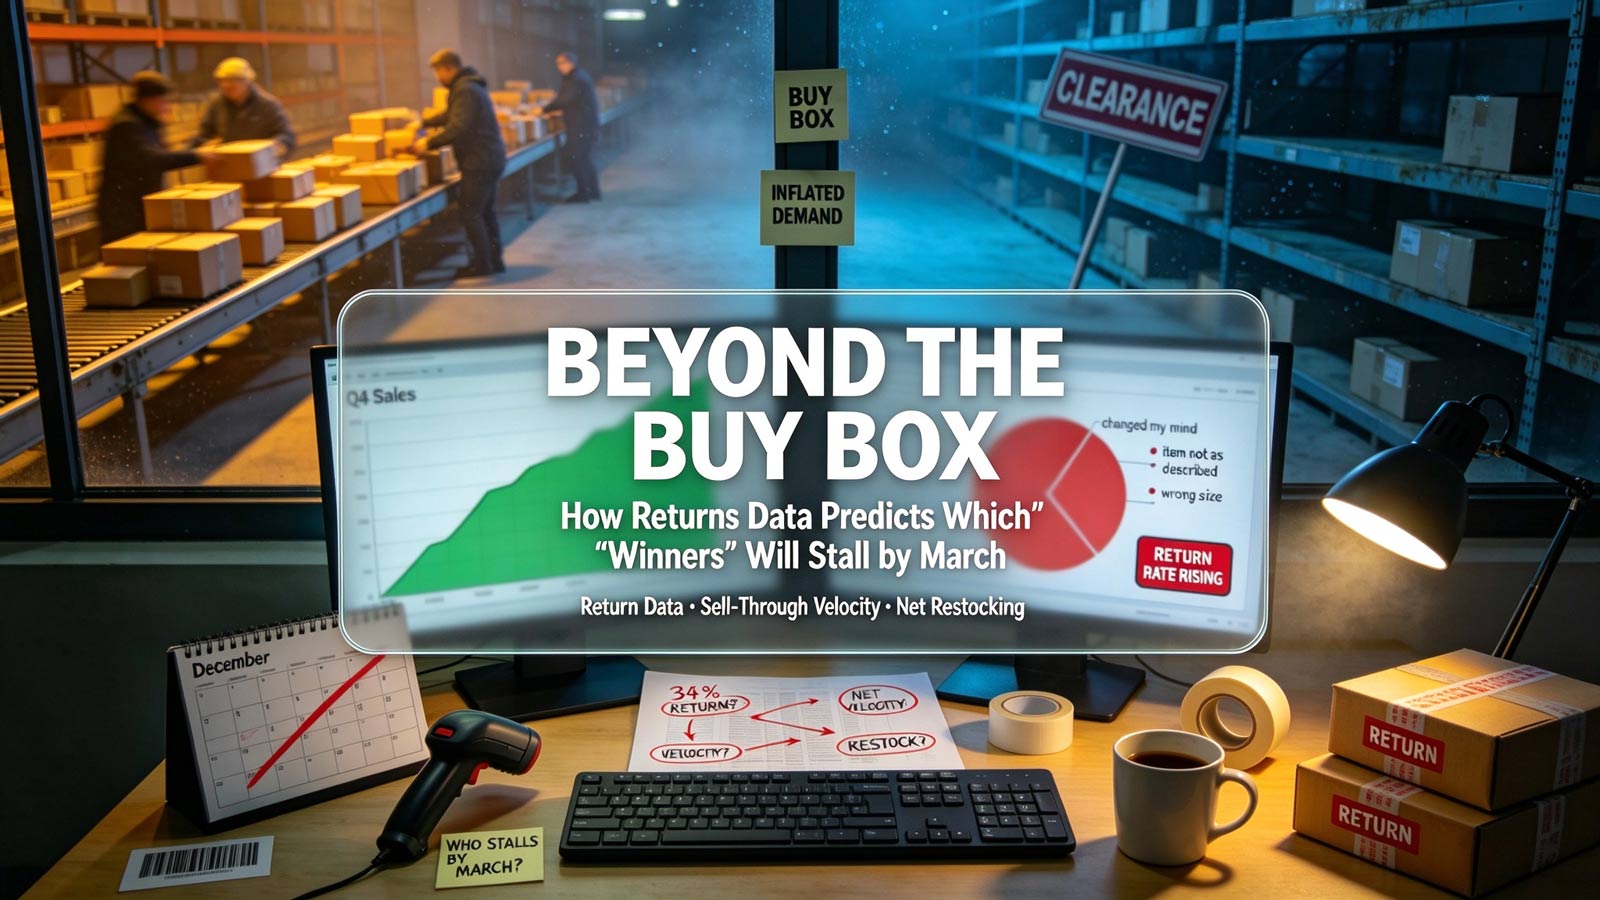
Returns data is more than just a record of dissatisfied customers—it's a record of retracted demand. Every sale is demand happening; every return is demand being taken back. When customers return items, they often provide reasons such as "item not as described," "wrong size," or "changed my mind." These reasons can be categorized and analyzed to separate real product-market fit from seasonal noise. For example, if a high-velocity SKU has a climbing share of "changed my mind" returns, its Q4 sales were likely inflated by impulse buying rather than genuine need.
Beyond the obvious reasons, returns data can also reveal subtler trends. Cross-referencing return reasons with sell-through velocity lets sellers spot the most dangerous quadrant in e-commerce: fast-selling products with fast-rising returns. These are the "winners" in quotation marks—SKUs that look unstoppable in December and become unsellable in March. By the time the markdown season exposes them, the capital is already locked in inventory.
-
Demand Quality Signals: "Item not as described" and sizing returns at high velocity indicate traffic-product mismatch—the faster it sells, the bigger the problem compounds.
-
Inflated Demand Markers: "Changed my mind" and "no longer needed" returns point to gift and panic purchases—buyers who were never your real customers.
-
Discount Dependency: If return rates rose as your markdowns deepened, the demand was price-driven. When the price recovers in January, the sales—and the buyers—disappear.
How Returns Data Predicts Customer Behavior
Returns data predicts what happens when the holiday tide goes out: gift purchasers who return rarely come back; buyers who keep a product become repeat customers. That distinction reveals which Q4 cohorts stay active into Q2—and which were one-time tourists.
Segmentation sharpens this: gift-buyers order late, return into January and February, and never engage with the product. A December SKU heavy on late shipments, size exchanges, and "no longer needed" reasons is showing borrowed demand that settles only after the return window closes—so planning on gross December sales means forecasting with half the data.
Timing turns prediction into planning. December orders sit inside 30-to-90-day return windows, so Q4's refunds land in February—after replenishment is already ordered. When the discounts stop, real winners keep selling and inflated SKUs flatline by late February. March isn't when the problem starts—it's when it becomes impossible to ignore.
Turning Returns into a Competitive Advantage
To transform returns from a cost center into a strategic asset, sellers must adopt a proactive, predictive approach. First, restock on net velocity—sales minus returns—rather than gross sales. A SKU that sold 1,000 units and returned 250 is a 750-unit product, and replenishment decisions should treat it that way. Marketplaces with lenient return policies have trained customers to expect frictionless refunds; sellers who accept this reality and plan around it hold the informational advantage.
Second, fix the listing before fixing the inventory. If a product has a high return rate due to sizing discrepancies or misleading photos, update the size chart and imagery before the next purchase order—not after the next wave of returns. Every unit of a mismatched SKU you restock converts into future refunds and negative reviews.
-
Restock on Net Velocity: Base replenishment on net sales, and reallocate budget from high-return "winners" to high-velocity, low-return products that deserve the capital.
-
Wire Return Reasons into Reorders: A return-reason tag shouldn't end at the refund—feed it into the SKU review that triggers every restocking decision.
-
Plan March Markdowns in November: If a SKU shows multiple warning signals now, decide today whether it gets a second chance or a pre-planned clearance path. Controlled exits beat panic markdowns.
Conclusion
The Buy Box still matters, but returns data reveals the quality of the demand behind it. By reading return reasons alongside sell-through velocity, sellers can avoid restocking inflated products and enter March with inventory that actually moves.
Your March P&L is being written in your November and December return reasons—read it before it reads you. Sellers who wire returns into replenishment, pricing, and markdown timing won't just survive the post-holiday reset—they'll emerge holding the inventory that actually sells.