Introduction
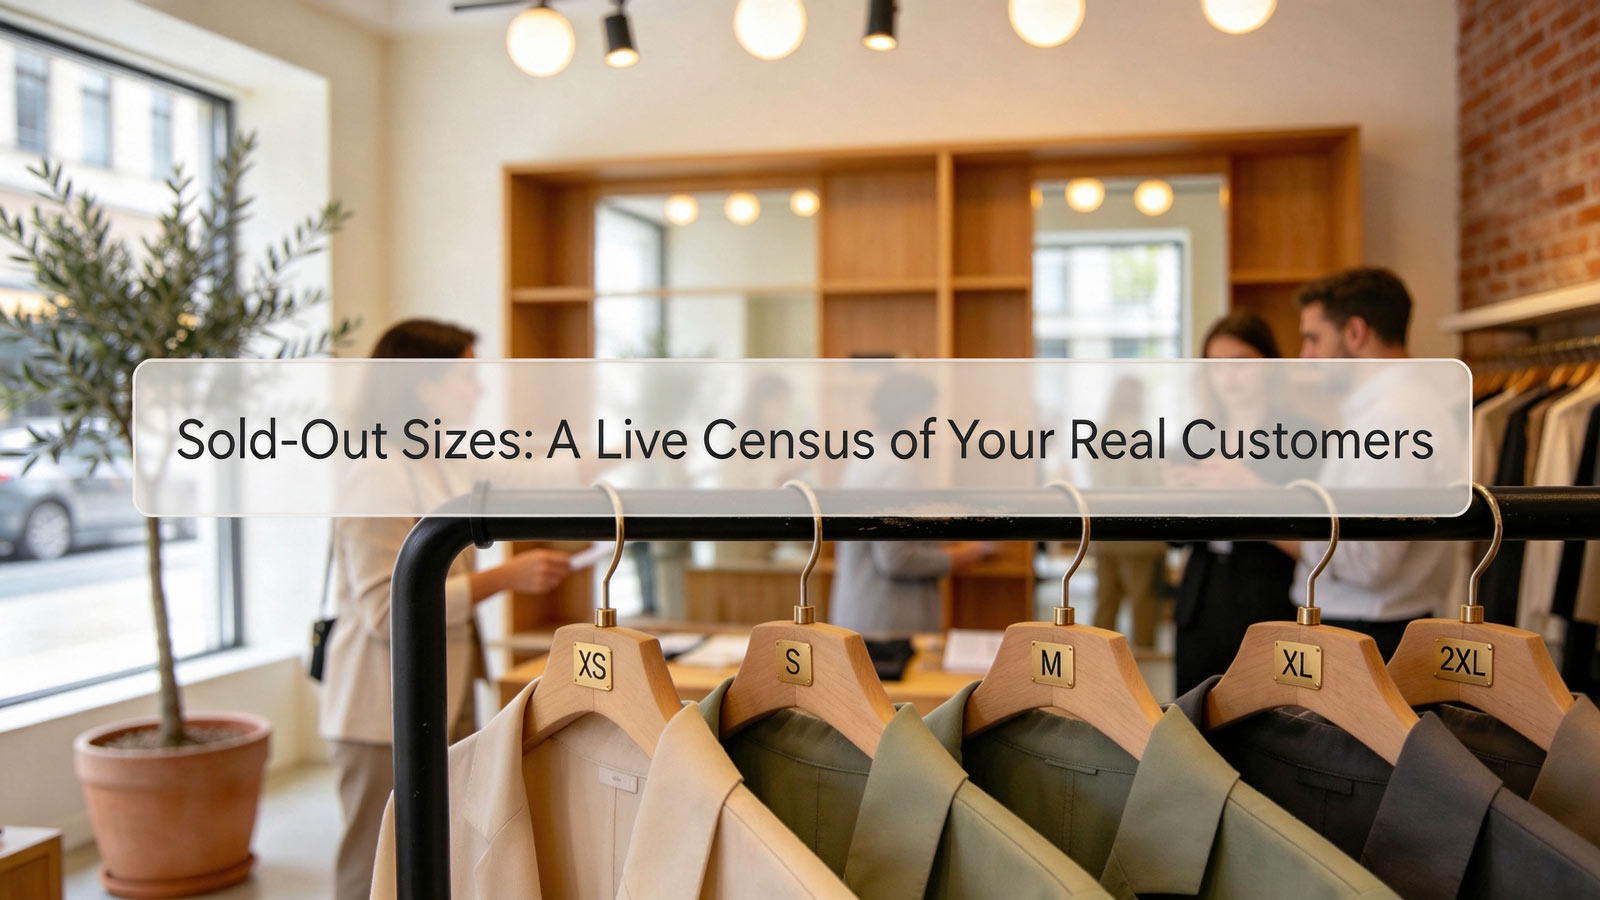
Every apparel and footwear store publishes a size chart. Few realize the chart is a confession, and the confession is updated daily in the inventory feed. When a size disappears from the grid, it is not a logistics hiccup. It is the customer base voting with its feet, and the vote tally sits in plain sight: which sizes vanish first, how long the gaps stay open, and which sizes are left behind on the shelf. Two stores can sell the same product at the same price while serving almost opposite audiences, and the difference shows up first in their sellout order. One store sells out of mediums in nine days because its customers are mainstream fit profiles buying for regular use. Another sells out of extra-smalls and double-extra-larges first because it has quietly become a destination for fit outliers the big retailers ignore. This article examines how sold-out sizes expose a store's real customer demographics, why sellout sequence reveals more than any customer survey, and how to read a size run as a demand map rather than a warehouse problem.
Three Forces That Make Size Runs a Customer Map
-
Sellout order encodes the audience. A size run does not deplete randomly. Demand follows a curve, and the curve's shape is drawn by the people who actually buy. Core sizes selling out first marks a mainstream audience. Edge sizes selling out first marks a niche audience that has nowhere else to shop. The sequence in which sizes disappear is the audience's silhouette, traced in inventory rather than declared in a marketing deck.
-
Sellout speed exposes purchase intent. A size that sells out in days is being bought with intent: the customer knows the product, knows the fit, and is unwilling to wait. A size that lingers for months is being bought cautiously, returned often, or not bought at all. The velocity gap between the fastest and slowest size is a direct measure of how decisively the store's audience wants the product.
-
Restock lag reveals how well the store understands its own demand. A store that replenishes its best-selling size within two weeks has read its map correctly. A store that leaves a core size empty for two months either cannot afford the inventory or never noticed the pattern. The size of the blind spot—measured in weeks of empty shelf—is the size of the gap between what the store thinks it sells and what it actually sells.
What the Sellout Data Looks Like
The economics of a size run rest on one trade: inventory breadth to cover the curve, against inventory depth to serve its peak.
-
Sellout concentration: In a healthy apparel size run, the top two or three sizes typically absorb 50-60% of total units, following a rough bell distribution around the brand's core fit profile. When one size claims more than 35% of sales, the store is serving a narrower audience than its size chart suggests.
-
Time-to-sellout: Core sizes in well-matched stores move 3-5x faster than edge sizes. A compressed ratio—edge sizes nearly matching core velocity—signals a niche audience concentrated at the tails. An extreme ratio signals a mainstream audience with little demand beyond the center.
-
Return and exchange pressure: Fit-driven returns typically consume 20-30% of apparel orders, and the distribution of those returns maps directly onto size confusion. When exchanges cluster heavily around one boundary size, the size chart is lying at that boundary, and the store is paying shipping costs to learn it.
-
Back-in-stock conversion: Customers who sign up for restock alerts convert at 20-40% when the size returns. That queue is not a waiting list. It is an order book written in advance, quantifying unmet demand size by size.
-
Markdown asymmetry: End-of-season discounts hit edge sizes first and deepest. A store whose clearance rack is all smalls and 2XLs has confirmed its audience sits elsewhere. The discount depth required to clear a size is the negative image of that size's natural demand.
Five Signals a Store's Size Run Is Telling the Truth
-
The first size to sell out matches the marketing. The store advertises to athletes and the 9 sells out first, the story and the audience agree. The store advertises to athletes and the 6 sells out first, the marketing is speaking to people who are not buying. Sellout order is the audit of every brand claim.
-
Edge sizes have their own momentum. In a niche-serving store, the edge sizes sell out on schedule, return less, and rarely hit clearance. That combination—reliable, patient, fit-loyal demand—is the signature of an underserved audience that found a home. Losing these sizes to stockouts costs more per customer than losing a core size.
-
Restocks arrive before the queue cools. A restock that lands within the demand window recovers most of the waiting customers. One that lands after eight weeks recovers a fraction, because intent does not wait. The recovery rate by week is one of the cleanest measures of how urgently the audience wants the product.
-
Size-specific reviews mention fit accuracy. When reviews for sold-out sizes repeatedly confirm "true to size," the store has converted fit confidence into repeat behavior. When they debate sizing across dozens of comments, the store is manufacturing hesitation at exactly the sizes where demand should be strongest.
-
The size curve stays stable across seasons. One season of unusual sellouts is noise. Three seasons of the same shape is a demographic fact. The stable curve is the store's real customer base drawn in inventory, and it should dictate buying, marketing, and eventually product design far more than any stated target persona.
The New Operational Bar
Reading size runs as demand maps is only useful if the store acts on what it finds. Four capabilities separate a store that manages its curve from one that is managed by it:
-
Curve-based buying: Allocate depth proportional to the observed sellout curve, not to a vendor's default size ratio. Vendor ratios are averages across thousands of stores; a store's own sellout history is the only ratio that matches its own audience. Recalculate it every season.
-
Restock discipline: Set maximum gap thresholds by size—core sizes restocked within days, edge sizes within a defined window—because an empty core size is revenue abandoned, while an empty edge size can be a strategic wait measured against its restock-alert queue.
-
Fit feedback loops: Feed return and exchange reasons back into the size chart and product pages within weeks, not seasons. A boundary size with chronic exchanges is a product data problem masquerading as a demand problem.
-
Niche protection: When edge sizes show loyal, low-return, full-price demand, protect that inventory first. It is the moat. A competitor can match a core size overnight; matching a cultivated 2XL customer base takes years.
Conclusion
A sold-out size is usually filed under fulfillment, but it belongs under customer intelligence. Every sellout order records who the audience actually is. Every sellout velocity records how badly they want the product. Every restock lag records how honestly the store reads its own demand. Read together, the empty cells in a size grid compose the real customer base of the business: its center of gravity, its loyal fringes, its fit confidence, and the gaps between the customers it claims and the customers it has. Stores that buy against their own sellout curves, restock against their own queues, and defend the niche sizes competitors neglect will find their inventory quietly doing market research for them. The size chart was never a static table. It is a live census—and the store that learns to read it stops guessing who its customers are.