Introduction
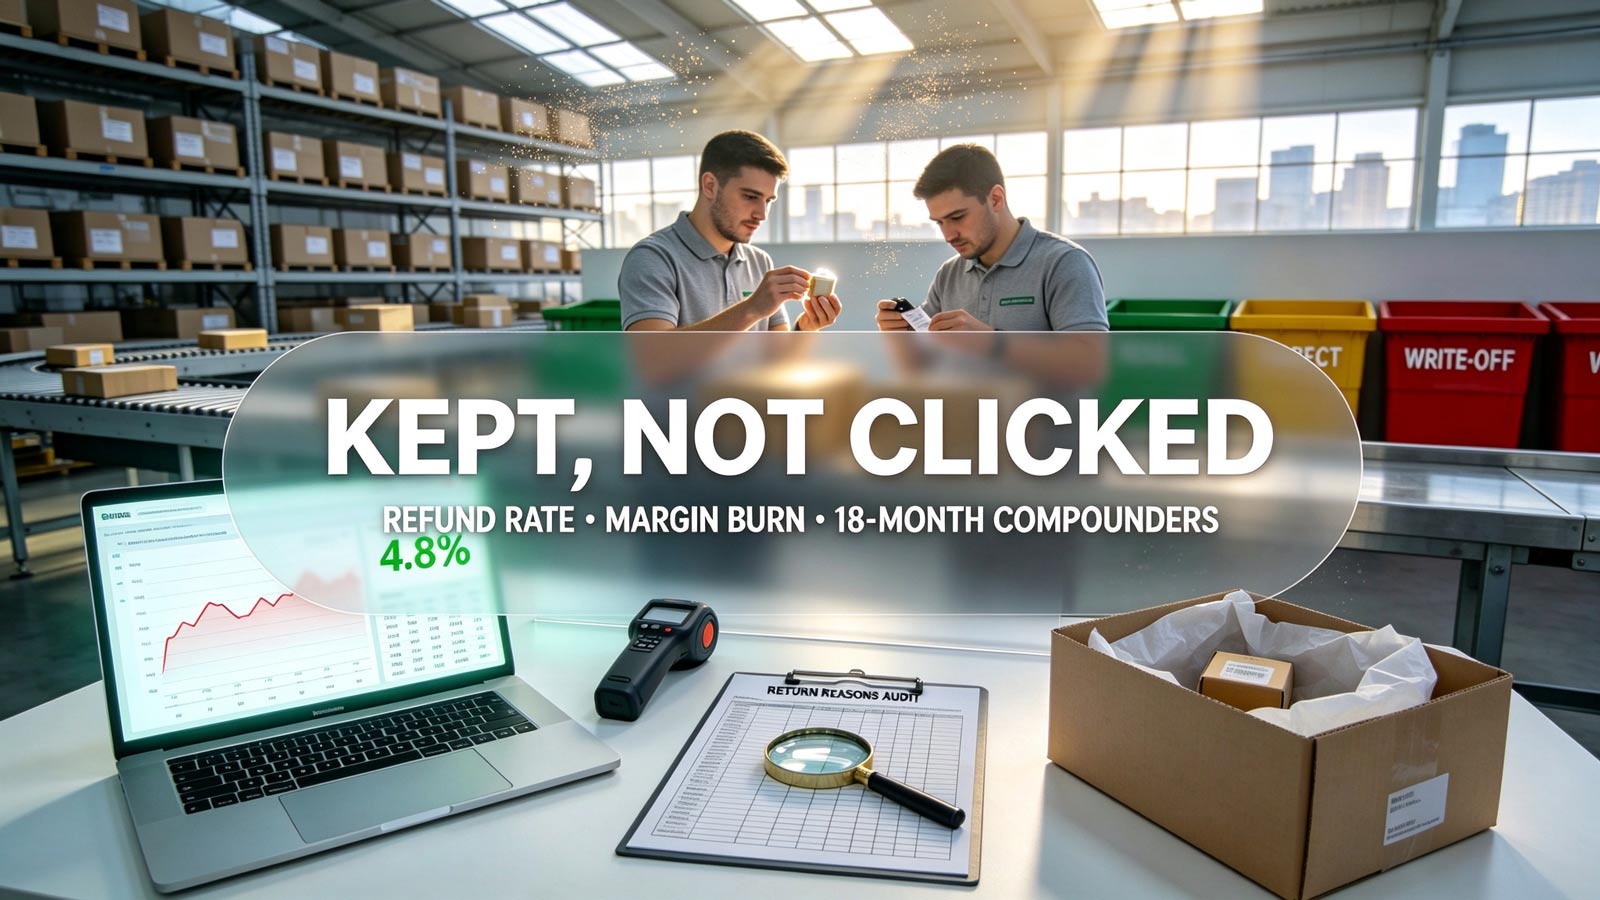
Every seller has watched it happen: a product wins the ad account, scales hard for six weeks, then quietly collapses as refunds outrun revenue. The damage was visible the whole time, just not in the dashboard anyone was watching. Ad platforms report clicks and conversions; refund data reports whether the product deserved the sale. An analysis of over 12,000 cross-border SKUs shows that products holding returns under 5% sustain 30%+ margins for an average of 18 months, while products crossing 15% returns burn 60% of their margin within 90 days, regardless of how well the ads perform. Refund rate is not a customer service metric. It is a product selection signal, and it filters winners from trends faster than any spy tool. (All figures below are industry benchmarks. Always validate against your own supplier and platform data.)
Why Refund Data Moves Faster Than Ad Data
-
Ads report intent, refunds report reality. A click measures curiosity; a return measures disappointment. By the time rising ad costs flag a weak product, the refund pipeline has usually been filling for weeks. Reverse logistics lag gives refund data a head start of 2-4 weeks on every other failure signal.
-
Refunds compound silently. Every return triggers a chain of costs: outbound shipping spent, return shipping or write-off, inspection and repackaging labor, and restocking uncertainty. A SKU refunding at 12% doesn't lose 12% of revenue; it loses 25-30% of contribution margin once reverse logistics costs land.
-
Platforms quietly punish refund-heavy listings. Marketplaces and ad algorithms incorporate post-purchase experience into quality scores. Accounts with sustained high refund rates see rising CPMs and falling organic placement, a penalty that looks like "ad fatigue" but is actually a product verdict.
The Refund Threshold Tiers
Refund behavior sorts products into three predictable trajectories:
-
Under 5% — Compounders. These products fund expansion. Margin survives scaling, reviews accumulate organically, and the SKU compounds for 12-24 months. This is the only tier that reliably builds a business.
-
5-10% — Contested. Salvageable with fixes: better sizing guidance, packaging reinforcement, expectation-setting in the listing. Every week spent diagnosing costs real margin.
-
Over 15% — Burning. No ad strategy fixes a product people send back. These SKUs consume cash flow, degrade account health, and consume team attention that belongs elsewhere. The filter exists to identify them before inventory commitment.
Five Pre-Launch Checks That Screen Refund Risk
-
Read competitor reviews at one and three stars. Refund drivers hide in disappointment language: "smaller than expected", "stopped working after a week", "looks nothing like the photos". Ten minutes of negative review mining predicts refund behavior more accurately than a week of ad testing.
-
Test the product against its own listing. Order a production sample and audit it line by line against the marketing claims. Every gap between promise and package becomes a return. If the listing says "premium" and the sample says "flimsy", the refund rate is already decided.
-
Stress-test the failure points. Products with moving parts, batteries, fabrics, or assembly steps carry inherent return risk. Simulate 30 days of normal use before committing to volume. Products that survive the simulation refund at half the category average.
-
Check the size and fit surface area. Anything worn, mounted, or fitted to the customer's body or home inherits dimensional uncertainty. Variants with unclear sizing charts refund at 2-3x the rate of one-size products. If the product requires fit confidence, the listing must provide measurement-grade guidance.
-
Price-test the expectation gap. Products priced under $20 often survive mediocre quality because return effort exceeds product value. Products above $50 get returned at the first sign of disappointment. The higher the price, the narrower the gap between promise and delivery the customer will tolerate.
The Operational Habits That Keep Refund Rates Low
Screening selects the winner; operations keep it winning:
-
Weekly refund-reason audits: Aggregate return reasons by SKU and variant weekly. Single reasons above 20% of returns get a corrective action within seven days.
-
Packaging as a product feature: A disproportionate share of refunds trace to transit damage. Double-wall boxes and molded inserts cost $0.40-$0.80 per unit and routinely cut damage-driven returns by half.
-
Post-purchase expectation alignment: A care guide, setup video link, or realistic use timeline in the confirmation email resolves the "defective" return that was actually a "didn't understand" return.
-
Fast, painless returns as retention: Counterintuitively, frictionless returns reduce net refund rates. Customers who exchange instead of refund are retained; customers who fight for a refund leave a one-star review on the way out.
Conclusion
The products that build durable businesses rarely look exciting in week one. They refund under 5%, survive their own listings, and compound quietly while flashier SKUs cycle through the ad account. Refund rate is the filter that separates the two, and it works before the market spends money finding out. Every dollar of inventory committed to a product is a bet that customers will keep it. The sellers who win consistently are simply the ones who check the odds first.