Introduction
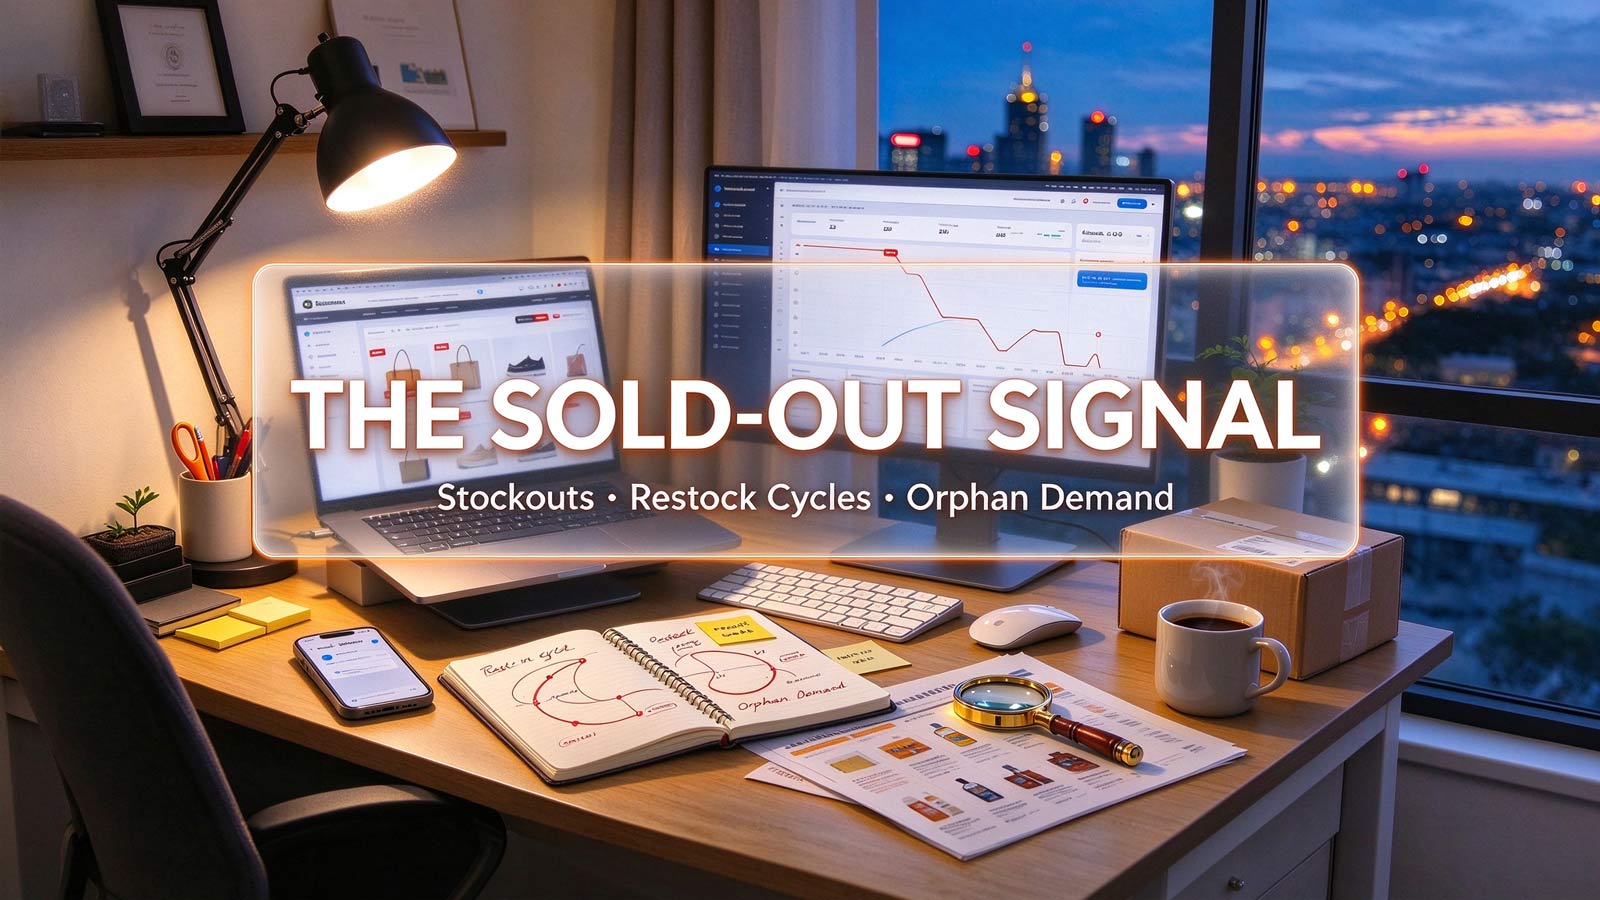
Every stockout is a confession.
A store will never tell you which products actually make money. Its homepage shows curated best sellers, its ads show whatever it's pushing this week, and its social feed shows products chosen for photography — not profit. But inventory doesn't lie, because inventory costs money. Nobody ties up cash in a product that doesn't move, and nobody lets a winner sit empty for long.
That means every "Sold Out" badge, every "Back in Stock Soon" email capture, and every quietly delisted SKU is a piece of demand data the store accidentally published. Most sellers never read it. The ones who do can see a competitor's revenue engine without ever seeing its dashboard.
Here's how to read the signal.
Why Stockouts Are the Honest Number
Marketing metrics can be manufactured. A store can boost its review count with incentives, inflate its traffic with bot-adjacent ad networks, and dress up its bestseller list by pinning products manually. Inventory is harder to fake.
Every unit sitting in a warehouse was paid for upfront — with real cash, at real wholesale prices. When a store runs out of something, one of two things happened: demand exceeded the reorder point, or the store miscalculated so badly it couldn't afford to restock. In practice, chronic restockers are almost always telling you the first story.
This is why stockout patterns beat almost every other public signal:
- Reviews tell you what buyers felt. Stockouts tell you what buyers did — with their money, not their opinions.
- Ad libraries tell you what a store wants to sell. Stockouts tell you what the market wants to buy.
- Traffic data tells you how many people arrived. Stockouts tell you how many of them converted hard enough to empty the shelves.
The Three Stockout Patterns (and What Each One Means)
Not all stockouts carry the same information. After tracking dozens of stores over multiple months, three distinct patterns emerge — and each one tells a different story about the business behind it.
Pattern 1: The Chronic Restocker
The product goes sold out, returns two to four weeks later, goes sold out again. This is the strongest single demand signal a store emits. It means:
- Demand is stable, not spiky. A one-time viral hit sells out once. A repeatable winner sells out on a cycle.
- The store's supplier can't keep up. Restock lag of 2–4 weeks usually points to overseas manufacturing with reorder minimums — useful intel on the competitor's supply chain.
- There's room for a second player. If a store is chronically stocked out, it is literally leaving revenue on the table. Every day that product is unavailable, its demand flows nowhere.
Action: cross-reference the restock cadence with the price history. A chronic restocker that raises price on restock has pricing power — arguably the best position any e-commerce product can occupy.
Pattern 2: The Seasonal Pulse
Stockouts that cluster around predictable windows — late November, mid-February, back-to-school — reveal a demand curve with rhythm. These products aren't trendy; they're calendrical. That's valuable precisely because it's boring: demand you can forecast is demand you can pre-position for, months ahead of the store that keeps getting surprised by its own success.
Action: note the stockout onset date each year. The store that stocks out on November 18th wasn't ready for November 1st. Next year, you can be ready two weeks earlier and capture the overflow.
Pattern 3: The Fake Scarcity
Some "Only 3 left!" badges are a JavaScript counter, not a warehouse fact. Real stockouts have fingerprints fake ones don't:
- Real stockouts usually remove the add-to-cart button entirely or replace it with an email-capture form.
- Real stockouts show up across size/color variants unevenly — a store rarely sells out of Medium and 2XL on the same day.
- Real stockouts correlate with review velocity. A product with 40 new reviews this month and a stockout is a real event; a stockout with zero review activity is theater.
Discount the fake pattern to zero, but note it anyway — a store running fake scarcity on a product is telling you its real conversion rate needs help.
How to Actually Track This
None of this works as a one-time visit. Stockout intelligence is a monitoring problem:
- Baseline the catalog. Capture the store's full product list with stock status — including variants — so you know what "normal" looks like. (ShopFindBiz shows a store's live product count and new-product additions in seconds; run it once a month and diff the snapshots.)
- Flag the flips. Any product that moves from in-stock to sold-out — or disappears entirely — is an event. Log the date.
- Watch the resurrection. Products that return after a gap are confirmed winners. Products that never return were either discontinued or unprofitable — and you can usually tell which by whether the demand signal (reviews, rest-of-catalog traffic) kept growing after death.
- Compare against the ad library. A store aggressively advertising a product it also keeps stocking out of has found its cash cow. A store advertising a product that's permanently in stock is still hunting.
The Opportunity Hidden in Other People's Stockouts
Here's where the signal turns into revenue. When a competitor's proven seller goes unavailable, its demand doesn't vanish — it becomes orphan demand. Shoppers who wanted that exact product in that exact week search for alternatives, and search engines and marketplaces are happy to introduce them to whoever is in stock.
The playbook:
- Identify a chronic restocker in your niche.
- Check whether its stockout cycles are getting longer (supplier strain) or its prices on restock are getting higher (demand outgrowing supply). Both mean the window is widening.
- Position an equivalent product — with your own photos, your own angle, and stock you can actually hold — for the keywords and audiences around that product's name and category.
- Time your push to the competitor's historically weakest month, which its own stockout calendar has just handed you.
You didn't guess the trend. You read it, in public, off a badge the competitor put on its own site.
The Caveats
Stockout reading is powerful but not psychic. Three warnings:
- Small catalogs skew the signal. A store with 12 products stocking out of 3 is a different story than a store with 4,000 stocking out of 3.
- Subscription and pre-order models break the pattern. A store on pre-orders never truly stocks out — read its shipping-delay disclosures instead.
- One stockout is noise. A pattern needs at least two cycles before it means anything. Patience is part of the method.
Conclusion
Every store publishes its most honest demand data in the one place nobody thinks to look: the gap where a product used to be. Reviews are opinions, ads are intentions, traffic is potential — but a sold-out sign is a purchase that already happened, repeated until the shelves were empty.
Start reading competitors' stockouts the way you already read their prices and their popups. The Sold-Out Signal is free, public, and updated in real time by the most reliable analyst in e-commerce: the customer with a credit card.
Install the ShopFindBiz extension and run a store analysis the next time a competitor's bestseller disappears — the product list, stock signals, and new-arrival cadence are all there in one scan. What the badge doesn't tell you, the pattern will.