Introduction
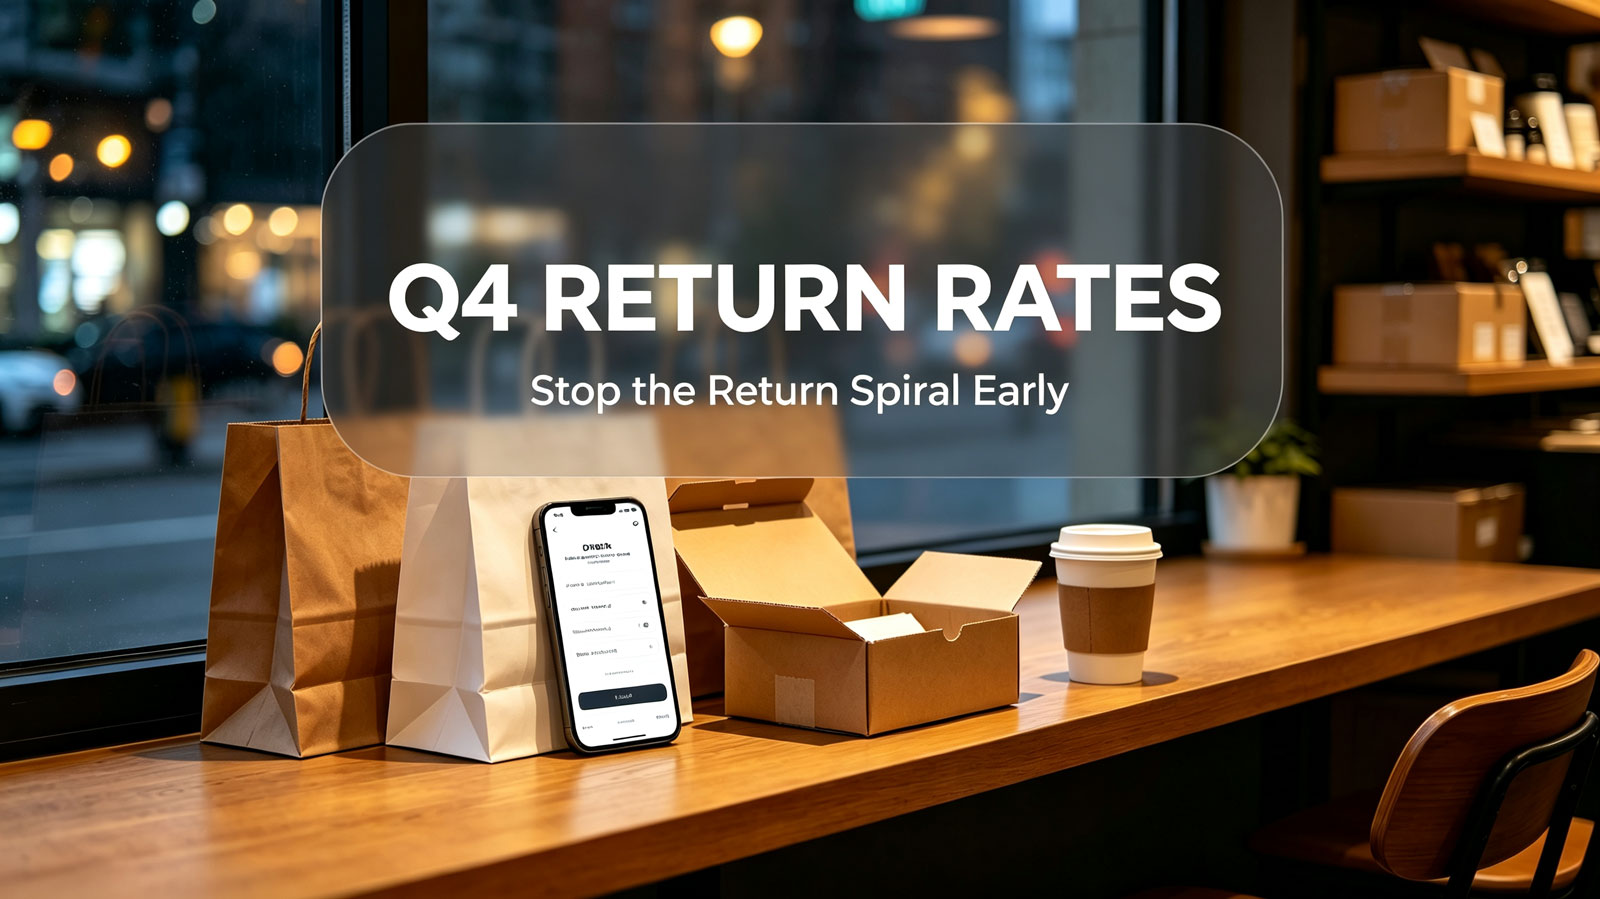
As e-commerce sellers prepare for the crucial fourth quarter, many are unaware of a silent profit killer lurking in their operations: rising return rates. While holiday sales and Black Friday promotions dominate strategic planning, the hidden costs associated with returns quietly erode 15–30% of per-order profit margins. This phenomenon becomes particularly acute during Q4, when discount-driven traffic and impulse purchases flood Shopify stores. The problem extends far beyond the simple loss of a sale — each returned item triggers a cascade of operational costs including reverse logistics, restocking fees, and potential markdowns for resale. Savvy sellers recognize that protecting margins requires preventative action long before the checkout page. By leveraging product data analytics and review intelligence systems, businesses can identify return-prone items and address the root causes before they impact the bottom line.
The Returns Spiral: How One Return Breeds the Next
The reason returns deserve their own Q4 strategy is that they don't just cost money — they create a self-reinforcing cycle. Here is how the spiral typically unfolds:
-
Rising return rates erode profit margins.
-
To compensate, sellers push deeper discounts to drive volume.
-
Discount-driven traffic converts quickly but buys impulsively.
-
Impulse purchases come back at significantly higher rates.
-
The seller discounts again — and the spiral tightens.
Breaking this loop requires shifting focus from managing returns to preventing them. The rest of this article breaks down where return costs actually hide, why Q4 inflates them, and the pre-checkout strategies that interrupt the spiral at its source.
The True Cost of Product Returns
Most sellers significantly underestimate the financial impact of returns by focusing solely on the lost revenue from the original sale. However, the complete cost structure involves multiple operational layers that compound profitability challenges. Our analysis of recent holiday seasons shows that reverse logistics typically costs 1.5–2 times more than outbound shipping, due to handling inefficiencies and transportation complexities. Returned merchandise frequently requires inspection, repackaging, and potential refurbishment before reentering inventory — processes that consume valuable labor hours while decreasing product value.
The deterioration continues when considering inventory velocity. Seasonal items returned after peak selling periods may require steep discounting to clear warehouse space. Our analysis of recent Q4 data reveals that 38% of holiday returns ultimately sold at 40–60% of original price points. Furthermore, certain categories like apparel experience irreversible value loss from try-on wear or packaging damage, rendering 12–18% of returns unsuitable for resale at any price.
Per-return cost breakdown (our internal analysis):
-
Reverse logistics: $10–$15 per return, versus $6–$8 for initial fulfillment
-
Labor overhead: 5–7 minutes of processing time per returned unit
-
Inventory depreciation: 22% average value decrease for restocked electronics
Why Q4 Exacerbates Return Problems
The holiday shopping season creates unique conditions that dramatically inflate return rates compared to other quarters. Our research identifies three primary accelerants during this period. First, gift purchases account for roughly a third of Q4 sales volume but generate return rates 2.3x higher than self-purchases, due to recipient mismatch issues. Second, promotional events like Cyber Monday encourage rushed buying decisions — our A/B tests show that products bought during flash sales carry a 28% higher return likelihood than those purchased after deliberate consideration.
The timing factor creates additional complications. Late December purchases often miss the gift-giving window, immediately triggering returns in early January. This surge coincides with seasonal labor shortages, stretching processing capacity and extending the cash flow impact. Perhaps most concerning is the psychological effect of discount culture — customers conditioned to expect deep promotions may intentionally over-purchase knowing they'll return unwanted items later, treating your store as a temporary showroom.
Category-specific vulnerabilities in Q4 return patterns (our store data analysis):
-
Apparel: 42% return rate, driven by sizing inaccuracies and fabric expectations
-
Electronics: 23% return rate, mostly due to feature misunderstanding
-
Home goods: 31% return rate, stemming from dimension misjudgments
Preventative Strategies That Actually Work
Forward-thinking sellers are shifting from return management to return prevention by implementing proactive measures throughout the customer journey. Product detail pages represent the first critical intervention point — our A/B tests show that enhanced sizing guides with video explanations reduce apparel returns by 19%. Augmented reality preview tools for furniture and decor items deliver even more dramatic results, cutting returns by 34% through better spatial understanding.
Review analytics provide another powerful lever. Machine learning systems scanning customer feedback can detect emerging return triggers before they become widespread. For example, multiple mentions of "runs small" in reviews allows for preemptive size chart adjustments or product page warnings. Some sellers now automatically surface relevant review excerpts during the checkout process to reinforce accurate expectations.
Three technical solutions delivering measurable ROI (based on our implementation data):
-
Predictive analytics: algorithms identifying return-prone customers based on 17 behavioral signals
-
Virtual try-on: 3D visualization reducing footwear returns by 27%
-
AI chatbot guidance: pre-purchase clarification cutting "not as expected" returns
Conclusion
The returns spiral tightens fastest during Q4, which means the window to break it is now — before the holiday rush begins. Sellers who invest in preventative technologies and process optimizations during Q3 will enter the peak season with stronger margin protection. Remember that every percentage point reduction in return rates flows directly to the bottom line — often representing more profit impact than equivalent sales increases, without the customer acquisition costs.
Start by auditing your own catalog: which of your products show the highest return likelihood, and what are the recurring complaints behind them? Store analysis tools like ShopFindBiz can surface return-risk signals across your product catalog and competitor benchmarks in minutes — so you fix the problem at the source, not after the package comes back.